Molecular Dynamics Simulation: Effect of Temperature
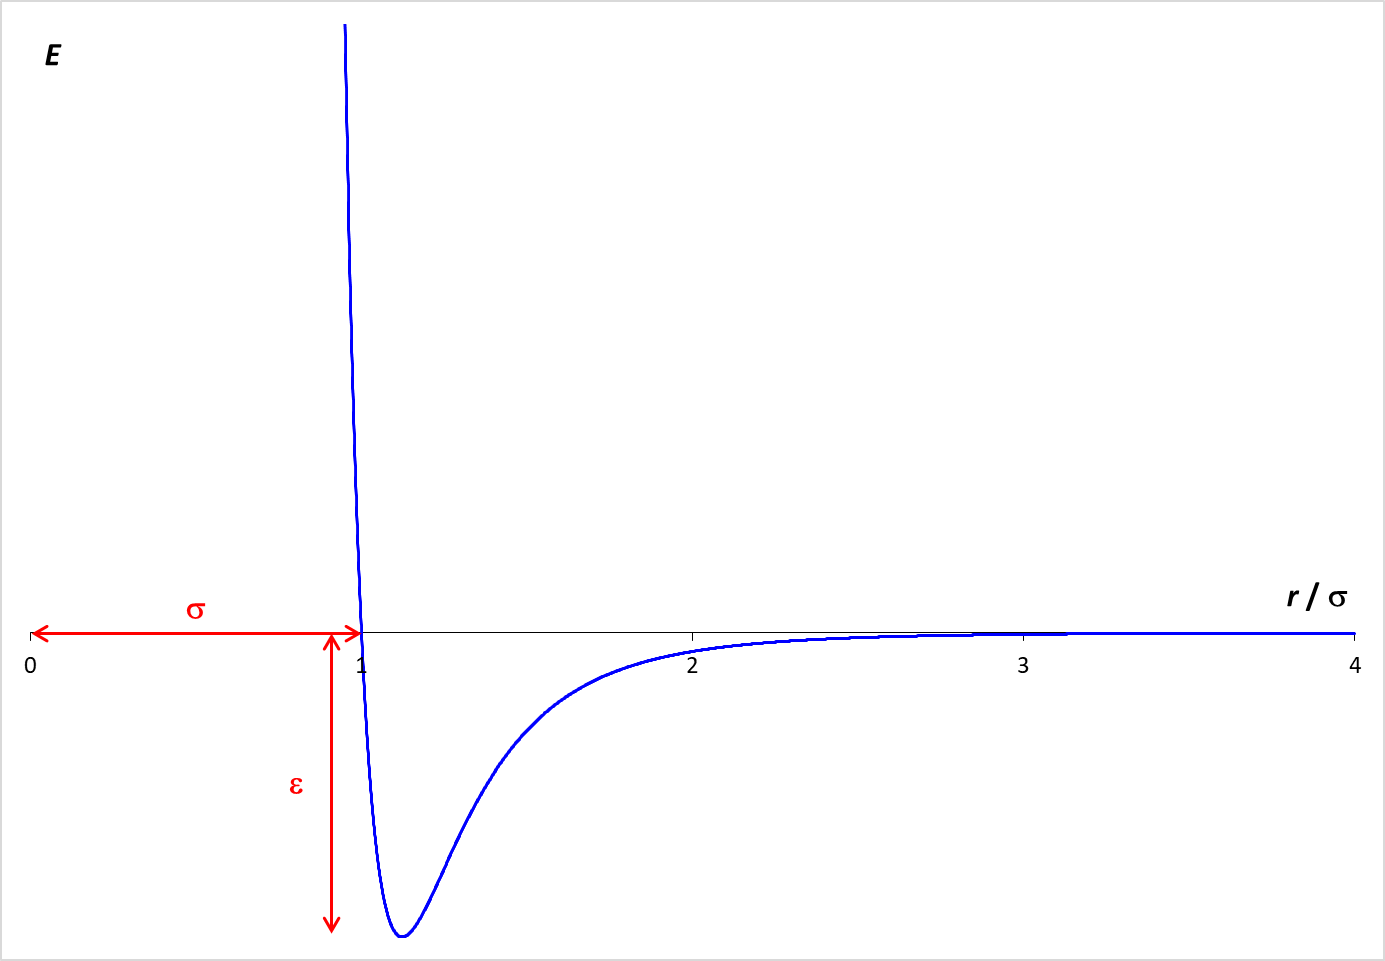
Statistical mechanics envisions matter as being composed of a large number of small particles in rapid motion. A simulation of this behavior is provided below. This simulation, called Molecular Dynamics, applies Newton's laws of motion to predict the paths of individual particles (molecules). The forces that operate on the particles are described by the Lennard-Jones potential, which is graphed at the right. The graph shows how the potential energy (PE) between two particles varies with the distance between the particles (r).
When the molecules are far apart, the PE is essentially zero. As the molecules get closer, there is an attractive force between the particles, which lowers the PE. The particles need to be fairly close together for this attraction to be relevant. In the simulation, the particle diameter is σ. Examination of the graph shows that the particles need to be within about two diameters ( 2 σ ) for a significant attractive force to exist. However, if the molecules get too close (within one diameter), the PE increases rapidly. This strong repulsive force drives particles away from each other and is the reason why the particle "bounce" off each other.
The depth of the Lennard-Jones energy well is ε which is equal to 500. J/mol in this simulation.

Simulation
- Enter the desired temperature (between 200 and 1000 K) and select the Set button.
- Start the simulation with the Start button. This button can also be used to pause the simulation.
- Observe the simulation at different temperatures. How does temperature affect the motion of the particles?
- Examine the distribution of speeds and the distribution of kinetic energy at various temperatures. How do these distributions relate to the observed behavior of the particles?
- The number of particles and the volume of the system are constant. These are the conditions under which Charles's Law applies. How does a change in temperature affect the pressure of the gas? Explain this effect on the basis of your observations of the behaviors of the particles at different temperatures.
After an initialization time, statistics for the collection of particles will be displayed. For low temperatures, it may take a minute or longer for the statistics to appear.
The bottom row of data show average values for the temperature, pressure and kinetic energy of the particles. For reference, the value of 3⁄2 R T is also provided. Over a very long period of time, the average kinetic energy should be 3⁄2 R T
A histogram shows the distribution of particle speeds or < KE > obtained from the molecular dynamics simulation. The blue curve is the theoretical prediction for the distribution.
Molecular Dynamics - Maxwell Distribution (version 3.0)
© 2018, 2023 David N. Blauch